RangeState-owned research · historical test record
Portfolio A.
See the test before the claim.
Eight H1 strategy configurations across six markets, shown with the test period, environment, data quality and drawdown rather than only an isolated equity curve. This is not an independent assessment.
Recorded result
The headline numbers, with context attached.
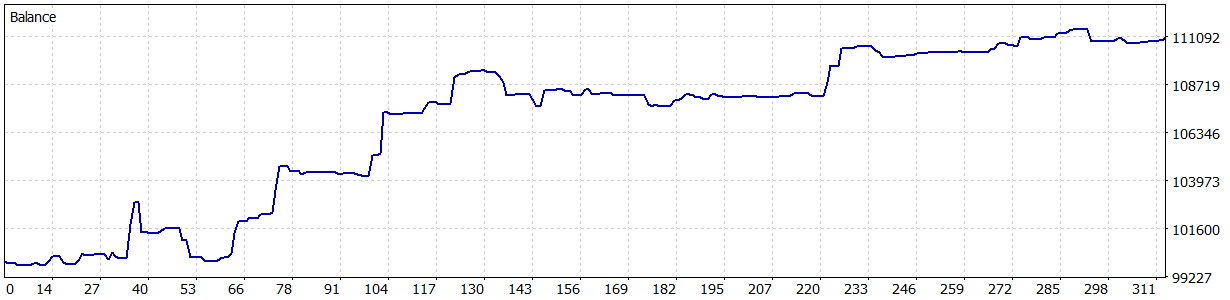
These figures come from the stored MetaTrader 5 Strategy Tester report for Portfolio A 1.3. They describe one historical test configuration and do not predict future performance.
Combined portfolio balance1 Jan–28 Jul 2026
Test manifest
What produced this result.
A number without its environment is not useful evidence.
- Product
- RangeState Portfolio A 1.3 MT5
- Period
- H1 · 1 January to 28 July 2026
- Markets
- XAUUSD, EURCAD, GBPJPY, USDJPY, EURUSD and BTCUSD
- Data quality
- 56% real ticks · 66,894,407 ticks
- Environment
- ICMarketsSC-Demo · MetaTrader 5 build 6061
- Account
- USD · 1:100 leverage
What this test does and does not show
One useful test is not proof of robustness.
A combined historical run
All eight Portfolio A strategies operating together in one recorded MT5 test environment.
Guaranteed future performance
Broker conditions, costs, execution, settings and unseen market regimes can materially change results.
Additional records not shown here
Cost stress, Monte Carlo analysis, separate periods and a matching forward-test record would address different questions, but none can guarantee future results.
Continue your review
Read the record without treating it as a purchase invitation.
Portfolio A is shown as a RangeState-owned research record, not a purchase invitation. Explore the factual evidence method or open the educational member library.